
With the help of the PlainStaff Capacity Planning module, projects can be planned better and more clearly, and above all, employee workload in project planning can be optimized at a glance. All changes to planning are initially made only in draft mode and are only applied when you click the "Save" button.
Project Planning
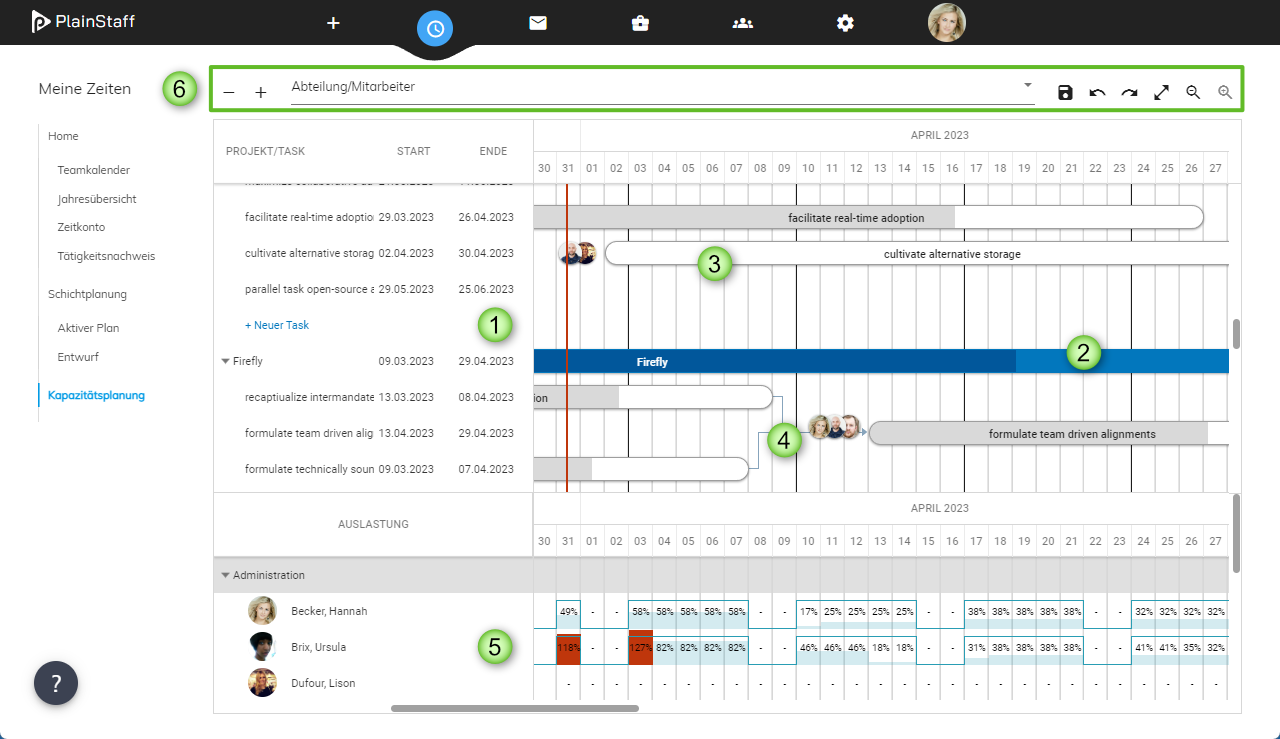
- The Task List shows all running projects (or the currently selected project) with their tasks.
- The Project Bars (colored) show the duration of the projects in the Gantt chart. The dark area represents the percentage consumption of the project's total budget. Clicking on a project bar opens the project dialog.
- The Task Bars (gray) show the durations and assigned employees of the project tasks in the Gantt chart. Here too, the dark area represents the percentage consumption of the task budget. The icons in front of the task bars indicate the assigned employees (up to 3 employees are displayed). A click on the task bar opens the task dialog. The task bars can be moved with the mouse, and grabbing the start or end of a bar allows changing its duration.
- Task bars can be connected with arrows by grabbing the round connector at the start or end of the task bar. These connections currently serve an informative function.
- The Resource List shows all employees with their capacities and workload.
- The Toolbar provides the following control elements:
- Collapse all projects
- Expand all projects
- Filter projects and tasks by employees or departments
- Save all changes made
- Undo the last change
- Redo the last undone change
- Zoom to full screen
- Zoom out timeline
- Zoom in timeline
Task Bars
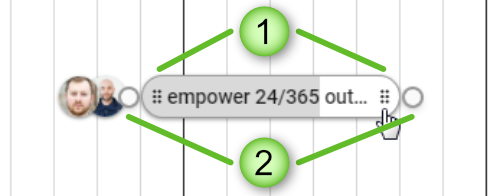
- Handle to change the length of the bar
- Handle to create connections between tasks
Capacity Chart
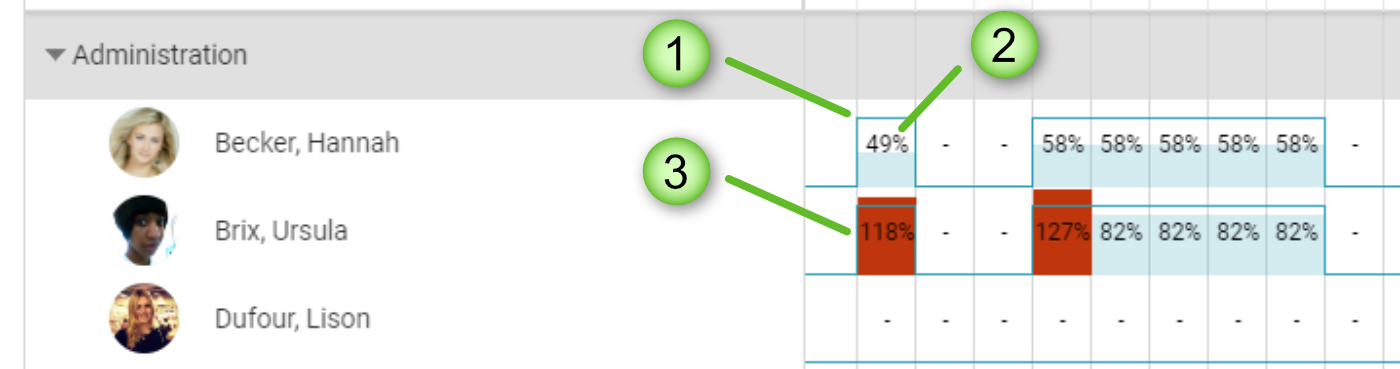
- The dark line shows employee capacity. This is derived from the working time model minus existing bookings. For Is=Target, Target=0, or Is=0 bookings, capacity is set to 0. For time bookings, the booked time is deducted from capacity. If employees are not 100% available for projects, capacity can be adjusted accordingly in the working time model.
- The light bar shows the planned hours and the percentage shows the quotient of planned hours to available capacity. The planned hours result from the planned hours specified in the task minus already booked hours distributed evenly across days with capacity > 0.
- If planned hours exceed available capacity, the bar turns red.